CN Soft Serve
CN Soft Serve
CN Soft Serve
Choosing a Snack Vending Machine is a business decision, not merely an equipment purchase. The right model must match customer demand, available space, operating hours, and service capacity. A machine placed beside a busy factory entrance faces different needs from one serving a quiet hotel lobby.
Industry data shows why careful selection matters. The National Automatic Merchandising Association reported approximately $26 billion in U.S. vending sales for 2022 in its 2023 State of the Industry report. Grand View Research valued the global vending machine market at about $21.84 billion in 2023 and projected continued growth through 2030. These figures indicate strong commercial potential, but they do not guarantee profit for every location. Location still matters.
This guide examines practical criteria, including machine capacity, refrigeration, payment technology, energy use, product visibility, and remote inventory monitoring. A compact machine may suit an office with limited floor space, while a high-capacity unit may better serve a university or transport hub. Cashless payments and telemetry can reduce missed sales and reveal which products move slowly. Small details decide. Reports also use different definitions and market boundaries, so their estimates should be treated as useful signals, not promises. The most reliable choice combines published research with direct observation: count foot traffic, inspect available power, review peak purchasing times, and test a realistic snack mix. A machine can look impressive yet perform poorly when refilling is difficult or service response is slow. The following sections provide a structured way to compare options, costs, and long-term operational risks.
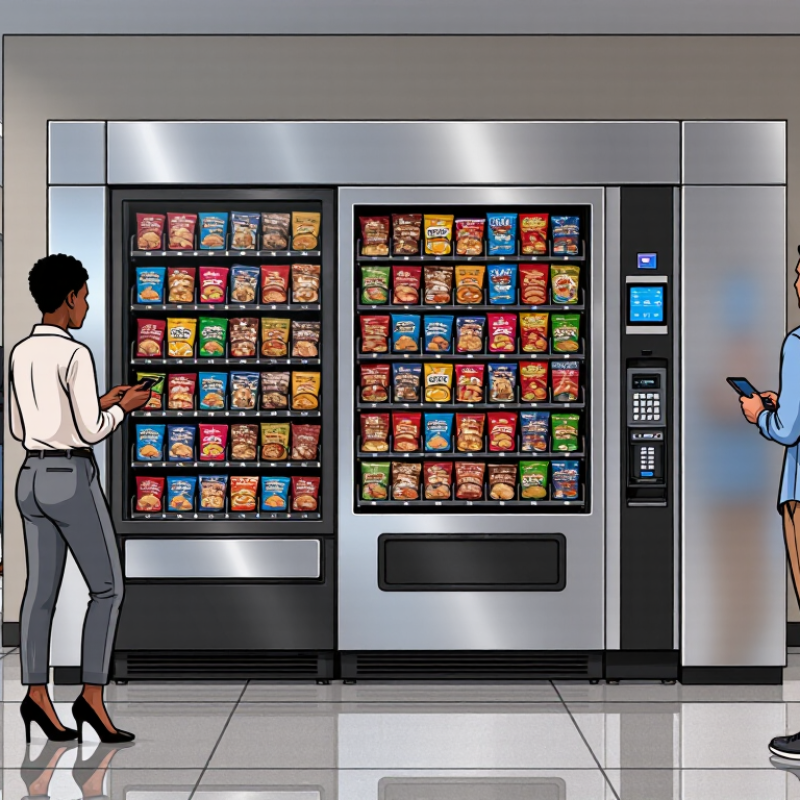
How to Choose a Snack Vending Machine for Your Business?
Define Demand Using NAMA’s U.S. Vending Market and Foot-Traffic Data
Choosing a snack vending machine should begin with demand, not appearance. NAMA’s U.S. vending market research can reveal broad purchasing trends, popular categories, and changing consumer habits. Use it as a dependable reference, not a perfect forecast. National data cannot show who walks past your lobby at 8:30 each morning.
Measure foot traffic for several weekdays and one weekend. Record entrances, waiting areas, shift changes, and nearby food options. A busy reception desk may produce fewer sales than a quiet staff corridor. Location matters more than raw visitor numbers. Count real movement.
My first estimate was too optimistic. I counted every passerby as a possible customer. That mistake inflated the expected sales volume. A better method separates employees, visitors, contractors, and children. Note when people stop, what they carry, and how long they wait. Even simple observations can expose useful patterns.
Match the machine’s capacity to these findings. A small office may need compact storage and frequent product rotation. A warehouse may require larger compartments and sturdy construction. NAMA data can guide category selection, while local observations shape quantities. Test a limited product mix for four weeks. Track sell-through rates, empty selections, and slow items. Leave room for correction. Real demand often behaves differently from the spreadsheet.
| Assessment Area | Metric | Reference Data or Planning Range | What It Means for Machine Selection | Data Status |
|---|---|---|---|---|
| Market Context | U.S. vending market size | Approximately $26 billion in annual U.S. vending sales, based on recent NAMA industry reporting. | Vending is a substantial convenience-services channel. The opportunity is strongest where products are available when staffed foodservice is limited or unavailable. | NAMA market reference |
| Demand Measurement | Qualified daily foot traffic | Count people who can realistically see, access, and use the machine during operating hours. Exclude delivery traffic, restricted areas, and duplicate counts where possible. | Use a two-week count covering both busy and quiet days before choosing capacity, machine quantity, or product depth. | Site-specific measurement |
| Low-Traffic Site | Qualified passers per day | Up to 100 people per day | Consider one compact snack machine with a focused assortment. Prioritize low energy use, simple replenishment, and a low upfront investment. | Planning band |
| Moderate-Traffic Site | Qualified passers per day | 101–300 people per day | A standard refrigerated or ambient snack machine may be appropriate. Select a model with flexible shelves and telemetry if replenishment routes are infrequent. | Planning band |
| High-Traffic Site | Qualified passers per day | 301–750 people per day | Choose a higher-capacity machine, a larger product range, or a second machine. Cashless payment and remote inventory monitoring become more valuable. | Planning band |
| Very High-Traffic Site | Qualified passers per day | More than 750 people per day | Evaluate multiple machines, a combination snack-and-beverage setup, or a larger automated retail format. Plan replenishment and service access before installation. | Planning band |
| Conversion Planning | Visitor-to-purchase rate | Use 1%–3% as an initial planning sensitivity range, then replace it with actual transaction data after launch. | A conservative conversion assumption prevents overbuying equipment and inventory before demand is proven. | Planning assumption; not a national average |
| Illustrative Revenue Test | Daily sales estimate | 300 qualified passers × 2% conversion × $2.50 average transaction = $15.00 per day. | This equals approximately $450 over a 30-day month before product cost, payment fees, service, rent, and taxes. | Transparent planning example |
| Product Mix | Shelf allocation | Start with a balanced mix of salty snacks, sweet snacks, better-for-you choices, and portion-controlled products. Adjust the mix using unit sales by selection. | A machine with adjustable spirals and shelves allows the assortment to change as local preferences become clear. | Operational recommendation |
| Payment Capability | Payment methods | Support cashless payment in addition to cash where customer access, network availability, and transaction economics justify it. | Cashless acceptance can reduce purchase friction, but transaction fees and connectivity costs must be included in the financial model. | NAMA-aligned evaluation factor |
| Capacity Planning | Replenishment interval | For a weekly service schedule, target enough capacity for at least seven days of expected sales plus a reasonable safety margin. | Higher-traffic locations need more selections, larger capacity, or more frequent servicing rather than simply higher prices. | Operating rule |
| Pilot Review | First 30–60 days | Track transactions, revenue, sell-through by product, stockouts, refunds, payment mix, and service visits. | Use actual performance to resize the machine, change the product mix, revise prices, or relocate the unit. | Recommended validation process |
Measure visitors, shift changes, and nearby food options for at least two weeks. A site with 150 daily visitors may need about 40 selections. This is only a starting estimate. Busy periods matter more than cabinet appearance.
Consider 40% salty snacks, 30% sweet products, and 30% healthier options. Treat these proportions as flexible guidance. Watch which spirals empty first. A full-looking machine can still sell poorly.
Choose enough depth for two or three days of expected demand. Fast-selling items may need double facings. Slow products should not occupy valuable space forever. Refill patterns may surprise you.
Compare annual energy-use figures before comparing purchase prices. Look for LED lighting, efficient cooling, sleep settings, and sealed doors. Keep airflow clear around the machine. Small maintenance mistakes can erase expected savings.
Avoid warm entrances and direct afternoon sunlight when possible. Heat makes cooling systems work harder. Leave space around the unit. Clean the condenser as instructed, even when sales look strong.
Subtract product costs, rent, electricity, payment fees, spoilage, labor, and service calls. Then divide monthly contribution by total investment. A $2.50 snack costing $1.00 has a 60% gross margin before expenses. That number is not profit.
Cashless payment access can protect impulse sales in busy workplaces. Cash-only equipment may miss customers without coins or bills. Include transaction fees in your forecast. Payment habits vary by location.
Review sell-through weekly and rebuild the product mix when needed. Collect at least four weeks of local sales data before trusting forecasts. My initial estimate may be too high. Real operations usually expose spreadsheet assumptions.
Choosing the right Snack Vending Machine starts with understanding the location and customer demand. Use foot-traffic patterns and reliable U.S. vending market data to estimate how many people may purchase snacks each day. Then match the machine’s capacity and product mix to expected vend volume, offering a balanced selection of popular, healthy, and convenient items without overstocking.
Payment flexibility is also essential, as digital transactions now represent more than 70% of vending sales in many markets. Select a machine that supports cashless payments and offers dependable security features. To reduce long-term operating expenses, consider ENERGY STAR-qualified equipment, which can use about 40% less energy than standard models. Finally, compare the expected payback period by reviewing product margins, location rent, maintenance, restocking, transaction fees, and service-call costs. A machine with moderate pricing but lower operating expenses may deliver better returns than a cheaper unit with frequent repairs or high energy consumption.